
Collaborative data science works best when you have the freedom to innovate in web-based workbooks that are open, simple, and intuitive to navigate. Combining the best of all worlds, we have built our own data science workbook for interactive data analytics. Here any data scientist can create collaborative documents using SQL, Python, and Markdown.
In what follows, we take you on a journey through the data science workbooks we developed as part of the Record Evolution Data Science Studio. You will get an overview of the features that make working with them unique.

Scroll down to the last section for a hands-on experience with the workbooks — we analyze a dataset and build a simple predictive model.
Why we built our own data science workbook
Data science workbooks are everywhere. The open-source Jupyter Notebook and Apache Zeppelin are the best-known and most widely used tools of their kind. But you also have the hosted service Google Colab, kaggle, as well as Observable, which has a strong focus on interactive data visualization using javascript (d3.js).
Considering all these open-source tools and the wide availability of existing workbooks, why would we want to build our own?
Here is why:
Combining the best features in one data science workbook
We wanted to cherry-pick the features that we liked most about other workbooks and create the product we always wanted to work with. So what did we do?
We combined VS Code, Observable, and TablePlus in one workbook.
Let’s start with the workbook design. We were aiming for a minimalistic, clean document-style look that is similar to Observable. So we reduced the number of buttons and other UI elements to a minimum so that you have enough space to focus on writing code and inspecting data.
Also, you can use the workbooks for reporting. By hiding the code, you switch to a document view to present your results to others. Here we use SVGs as the standard output of Python plots, and these can be resized without compromising on quality.
Most workbooks allow you to run a workbook card but not parts of the card. With our data science workbooks, you can use the cursor to select code and only run the code you have selected. This is a fantastic feature if you want to debug. We decided to add this feature after looking at SQL editors such as pgAdmin, TablePlus, and DBeaver.
When it comes to programming, we like working with Visual Studio Code. That is why we integrated the Monaco Editor, the core library that powers Visual Studio Code.
Tight integration with our data science studio
The automated data warehouse is the centerpiece of our data science studio. You start by connecting the platform to various data sources to extract data from databases, S3 buckets, web endpoints, IoT connectors, FTP servers, and more. Then you design automated data pipes that pull your incoming data according to a specific schedule and load it into the DWH relational database. This is how you get a solid foundation for your data analyses.
And this is where the workbooks come in. We wanted our data science workbooks to be fully integrated into this process. This is why we supplemented the typical Python workbooks (with Python libraries) with the option to easily run SQL queries and inspect your data.
Also, we wanted to integrate these SQL queries into the whole automation pipeline. The aim? When the source data changes, our defined SQL queries should also update, if the user wishes so. So we needed a good interaction of SQL queries and Python / Pandas DataFrame.
A typical analysis would start with preprocessing the data using SQL, exploring the data using plotting libraries like matplotlib or seaborn, feeding the resulting data into a Python machine learning library, and finally persisting the results in a database table.
We believe that SQL is superior to Pandas when it comes to data preprocessing (joining, filtering, and aggregating) — especially when dealing with a relational database. However, the workbooks allow you to do everything in Python as well. In this sense, the workbooks enable you to combine the best out of the worlds of Python programming and SQL.
Staying flexible
As our platform continues to evolve and as we continue to gather user feedback, we will keep adding new features to our workbooks. For example, we are planning to expand the programming language options. We will add support for javascript & R and improve the automated processing of machine learning models.
Having our own workbooks allows us to add features as we go and meet the needs of users right from the start.
The data science workbooks in action: let’s analyze some data
To demonstrate how it all works, we will analyze a small dataset called “Medical Cost Personal Data” (you can get the data from GitHub or kaggle). The dataset contains the medical insurance charges of 1,340 persons and information about their BMI, age, smoking habits, and number of children.
Load your data
If you want to follow along, sign up for the Record Evolution platform. From your homepage on the platform, create a new data pod and navigate to the sources panel to upload your files.
We will use the file upload panel. Select Quick Load to import your data into a database table:

For a continuous flow of data updates, you would create data pipes and use the platform’s core tables.
Create a new workbook
Now, navigate to the Analysis panel.
Create a new data science workbook to start with your analysis. When entering a new workbook, you will see an empty card with the option to select a workbook type: Python, Markdown, or SQL:

We will first create a Markdown card and write a brief description of our analysis.
When a card is selected, a menu appears at the bottom right-hand corner. From there, you can execute, stop or delete your card. These actions may vary depending on the card type.
Optionally, you can perform any action with a dedicated key command. You will find a description of all possible commands in the settings menu in the top right-hand corner.

Next, we create a SQL card below the Markdown card. You can do so by either clicking on the card’s add button or via the key command ctrl + s.
Start analyzing your data
Now we query the database to construct our dataset.
In general, you will often have scenarios involving multiple tables which you can join, aggregate, and filter. In our case, we select from the table we created with the CSV file. We select the columns we want to analyze and include in our model.
We have added two extra columns which are the combination of two columns. As we will see later, this will improve the model performance.

Every SQL card creates a new database table when executed. By running our SQL card, a table called “wkb_wk_1005” is created inside our database. This table contains the data defined by the query. We can access this table from any SQL or Python card.
Before building a predictive model, you usually do some data exploration. We will do so using Python. In order to access our prepared table, we create a Pandas DataFrame from it.
The Python environment provides three distinct functions to interact with tables of the relational database: getTable(), putTable(), and dropTable(). The getTable() function transforms a database table to a Pandas DataFrame, which we will use for further analysis in Python.

To illustrate, we will only show one example figure for data exploration.
The plot below provides insights into the relation between smoking, BMI, and insurance charges. We can clearly see a linear trend for smokers, whereas the non-smokers’ BMI does not seem to be a necessary variable. That is, a smoker with a high BMI is expected to have higher health insurance charges than a smoker with a low BMI. For non-smokers, BMI does not make a big difference in insurance charges.
This is the reason we added the extra variable smoker_bmi in the beginning. It allows the model to apply the linear trend only for the smokers.

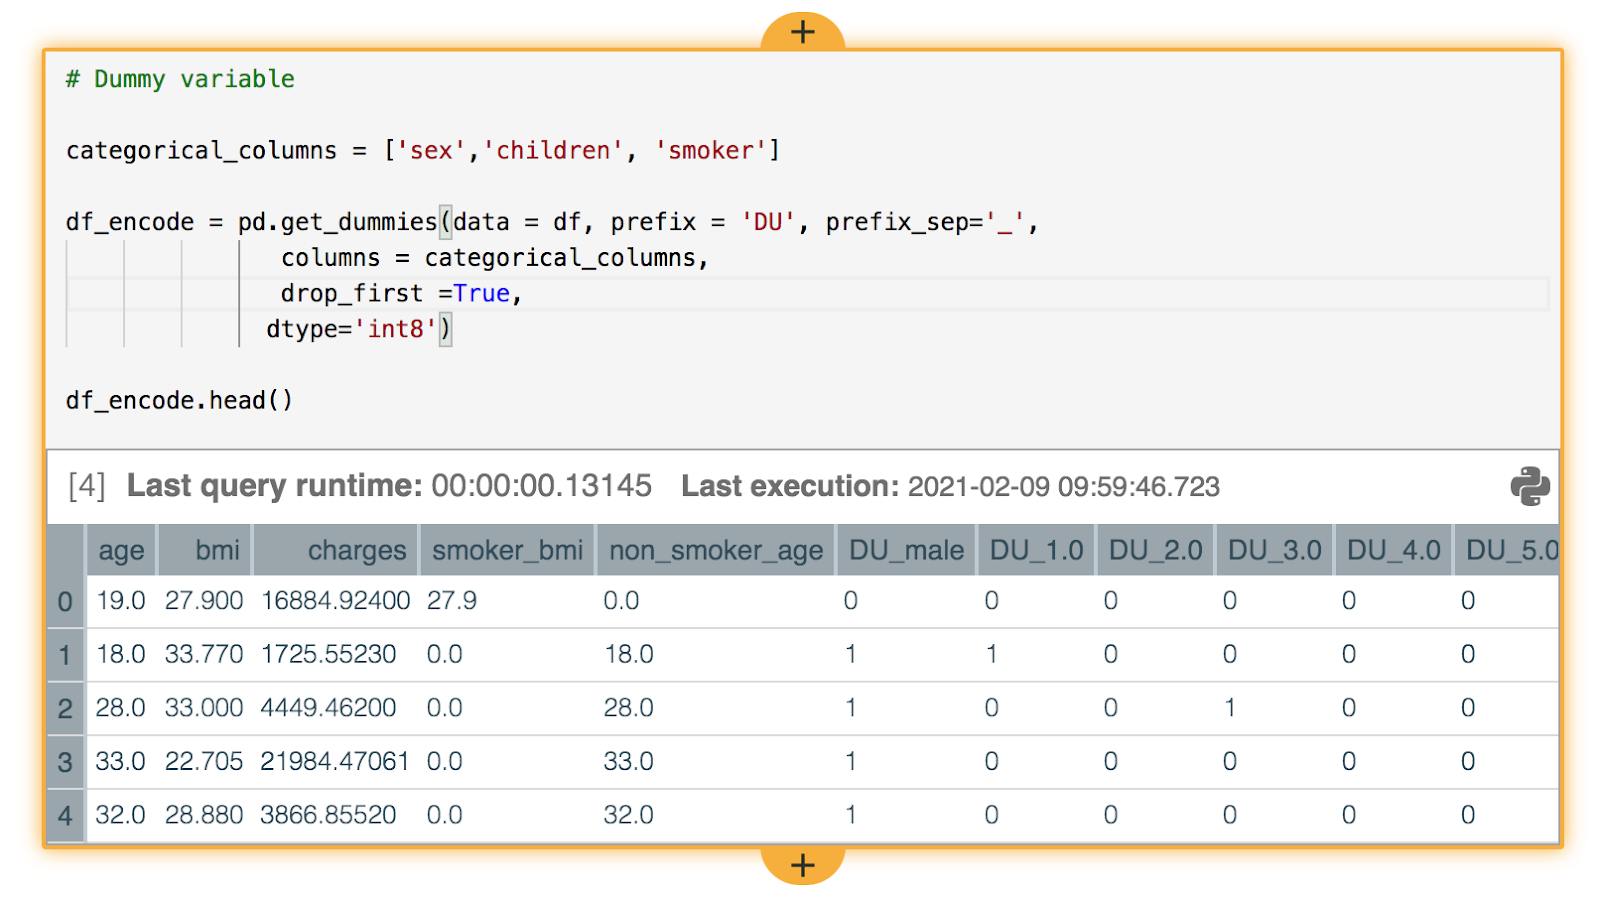
For our simple prediction model, we choose a linear regression with the variables age, BMI, smoker, number of children, and the extra variables we added. For the number of children, you usually create dummy variables:
We will use 80% of the data for training the regression model and the remaining 20% for testing. The regression is done using the LinearRegression module from Python’s sklearn library.

Finally, we want to determine the performance of our model. So we will make predictions with our test split and compare them to the real values. For a linear regression, we often look at the R squared value.
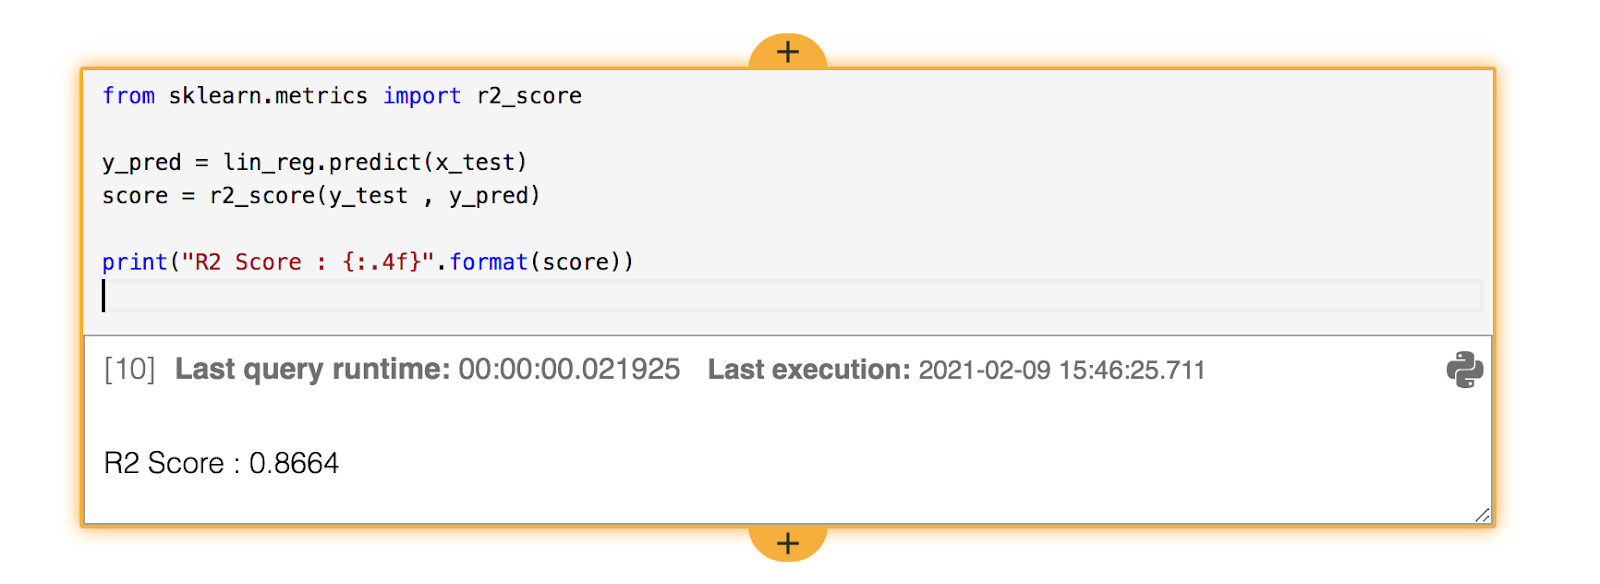
For a more detailed view of model performance, look at residual plots as well.
We conclude our analysis by saving our model parameters in a database table:

Now our model is persisted in the database for later use.
Conclusion and outlook
In this article, we’ve showcased some of the capabilities of the Record Evolution data science workbooks. We have seen a brief data analysis of our uploaded dataset and built a simple prediction model. In our analysis, we utilized the strengths of SQL and Python and showed how to exchange data from Python to SQL and vice versa.
However, this is only the beginning as there is much more you can do with this dataset.
Ultimately, the workbooks can be useful not only in terms of data mining but also when you get to do deep learning, train a neural network or develop your machine learning algorithm. Apart from typical tasks in basic statistics/descriptive statistics, statistical learning, and predictive analytics, we can work on any data science project here, write algorithms and develop artificial intelligence that we later roll out as IoT apps on devices.
The Record Evolution data science workbook becomes even more powerful when using data sources that are frequently updated (e.g. S3 buckets, web endpoints, etc.). You will read more about this in our next article. Stay tuned!
About Record Evolution
We are a data science and IoT team based in Frankfurt, Germany, that helps companies of all sizes innovate at scale. That’s why we’ve developed an easy-to-use industrial IoT platform that enables fast development cycles and allows everyone to benefit from the possibilities of IoT and AI.