
Data-driven decision-making is an essential pillar of business development and investment. It enhances the communication of good ideas, makes insights tangible to non-experts, and creates trust between clients and service providers. And surely, reporting businesses can only benefit from clean data pipelines and well-groomed data visualization. In what follows, I outline our perspective on how reporting businesses can enhance insight generation with customized dashboards.
The most important aspect of reporting visualizations is that they should be tailored to the needs of the target audience. For example, financial and insurance risk analysts are familiar with crunching numbers and presenting reports to executives as a digestible product. These reports can cover numerous topics, various time intervals, and vast geographical data. For instance, the time interval of the credit reports can vary from yearly portfolios to hourly stock price dynamics. Additionally, they can cover the businesses of several institutions all over the world or just one bank in a given region. The granularity of the data presented in reports is only one of the aspects that demand flexibility and automation.
Introducing Tableau Extensions
There are various out-of-the-box solutions on the market to answer this demand. They provide the required flexibility and automation at a reasonable cost and with minimum staffing. In this article, we focus on what we can do with Tableau. The analytics and visualization platform Tableau has been catering to the needs of reporting firms for over a decade. Tableau is a dashboard-style presentation tool with lightweight data analysis options with sample code and various resources for the Tableau developer. It has a fast initial learning curve, it is well adjusted to various data sources and file types, intuitive to use, and fun to experiment with.
On the one hand, the Tableau software provides several figures and table types and formatting options for visualization. On the other hand, it is mainly a click-and-drop tool that has its limitations. For example, a live feedback widget on your risk assessment reports cannot be built using any of Tableau’s click-and-drop features. Luckily, there is a way to easily develop a custom-tailored app that can be embedded into the Tableau visualizations dashboard by using the Tableau Extensions API.
Where Custom Extensions Come into Play
Tableau Extensions provide a headless browser-like interface in dashboards and an API to embed an application that can write/read data to/from the existing data sources and dashboards or communicate to a database. In a nutshell, it can accomplish almost all tasks that modern browsers can implement (i.e. similar to Chromium).
Customization with extensions
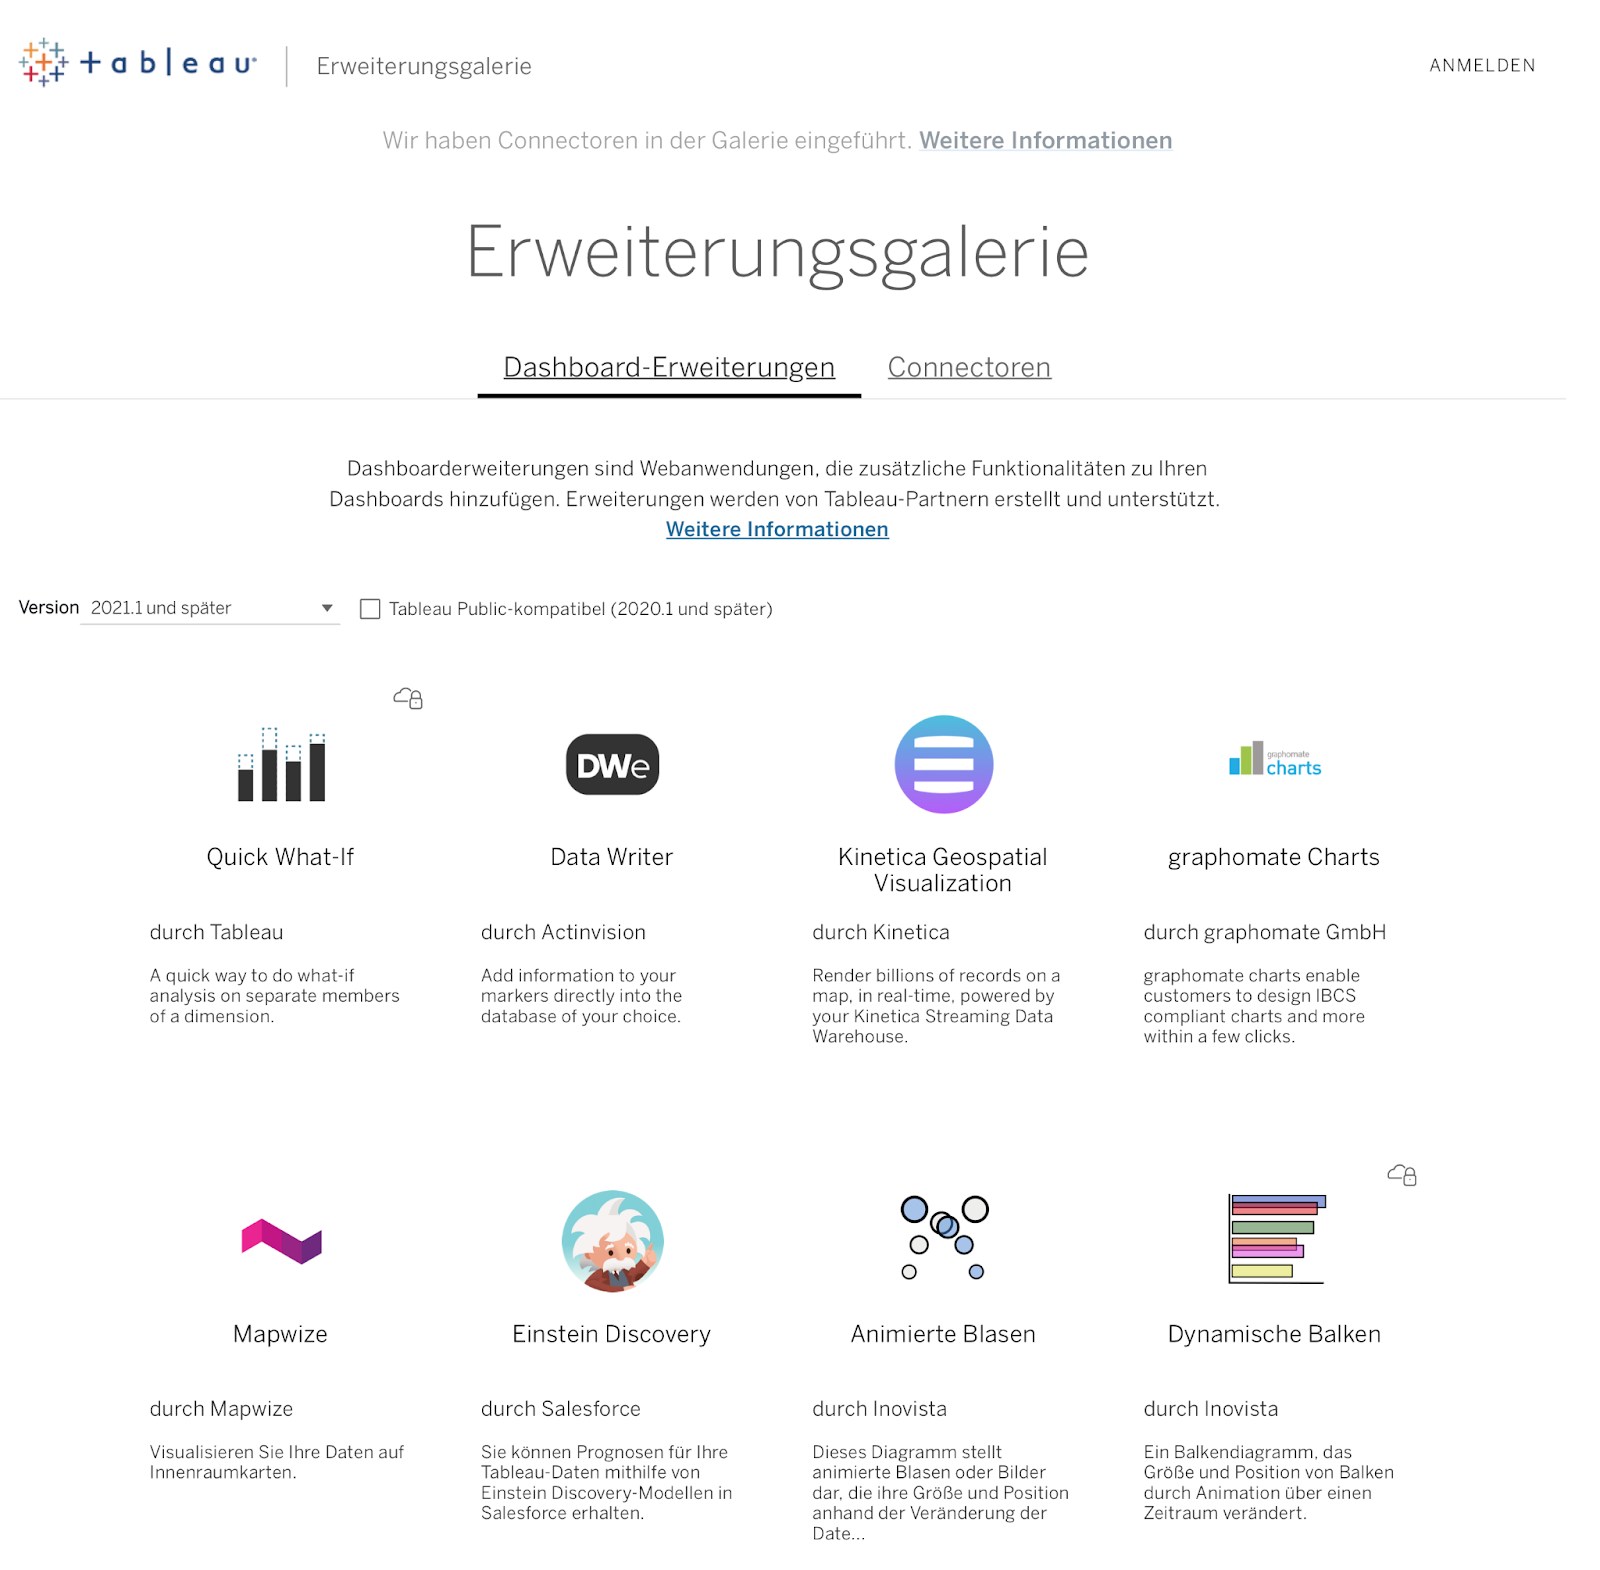
The customizations with extensions can provide the missing pieces of your report to address all the needs of the client. This includes comments by Tableau users, questionnaires, new visualizations, spell-checking, and custom testing, among others. (You might find an application for your needs on the Tableau Extension Gallery.) Dealing with extensions is not as trivial as dealing with click-and-drop features, however. It may require years of experience in web application development, depending on the complexity of the case.
Taking a concrete use case to show the power of extensions, one might look at data quality tests (DQTs ) for the data presented on dashboards. If the data source is an SQL server, the extension backend can be customized with SQL queries to create quality tests on the fly. This is an intricate job if one uses alternatives instead—either Tableau Rest API or Tableau Command Line Utility.

Once developed via the Extension API, on-dashboard tests can reduce non-trivial human errors, help the analysts debug data source queries, and increase the scientific precision of the reports. As a result, decision-makers at any level benefit from a trusted source of information that helps them decide either to invest aggressively or retract from a potentially destructive decision.
Custom visualizations
Another example is custom visualization: say a tree-type graph for company mergers over the course of several years. Such a graph is not a native figure type in the Tableau dashboard. But using well-maintained Javascript libraries (e.g. D3), an experienced developer can build the graph to enhance a manager’s view into the data. A Tableau Extension can provide a click-and-extend type of a tree graph with the merge information presented as a table upon hovering on nodes. The merge graph can be used as a dynamic filter to choose the data to be presented on a dashboard.
The Value Created by Extensions
Depending on the needs of your company or clients, custom enhancements of reports have the potential to add significant value to your business.
At Record Evolution, we have been consulting on data science and IT projects for many years. We help credit reporting companies enhance business insights using state-of-the-art visualization tools such as PowerBI, Tableau (Tableau Server), and Qlick, all of which can be customized and extended using native Extension APIs.
Get in touch to get all the details on implementing Tableau Extensions to get the most out of your Tableau data visualizations.
About Record Evolution
We are a data science and IoT team based in Frankfurt, Germany, that helps companies of all sizes innovate at scale. That’s why we’ve developed an easy-to-use industrial IoT platform that enables fast development cycles and allows everyone to benefit from the possibilities of IoT and AI.