
For over a decade, Tableau has been one of the big players in the realm of analytics and reporting platforms. The Tableau Desktop application helps BI developers yield well-groomed visualizations. Tableau Server is an enterprise-level platform to share reports and collaborate on reporting projects. The server is aimed at the dynamic interaction of its users, e.g. filtering data to observe a specific dashboard presentation. At the same time, many sectors still rely on the documentation of results as static reports (PDFs or CSV files). For example, this applies to areas such as bookkeeping and yearly inspections. In what follows, we consider a common use case for reporting businesses: how to optimize the production of 1000s of static copies of dynamic PDF reports produced by the Tableau Server.
We present the experience we acquired from a client project we recently closed at the credit rating and risk management firm parcIT. The project entailed data engineering and analytics in a Postgres data warehouse, reporting (a dedicated data visualization design in Tableau Server), and automation (application development with Node.js and Docker, with a clean frontend written in Javascript, HTML, and CSS).
In cooperation with our client, we optimized the production line, presented the data respecting their corporate design & banking guidelines, and secured the quality of the reports via automated tests. The target of the project was to produce 1000s of reports (e.g. credit portfolio, credit rating, model comparison) for one of the biggest bank groups in Germany: Volksbanken und Raiffeisenbanken, as well as various private banks.
How About Scaling?
The scaling of existing reporting solutions relies on the resources of the Tableau Server. This is often quite flexible as Tableau Servers run not only on bare metal Windows machines but also in clusters as virtual machines. Additionally, a containerized Linux implementation is also possible to set up but trickier to accomplish compared to the Windows version. This suggests that an in-scale production of static reports would be easy via an upgrade of the machine. However, there are several lessons to learn here before you can conclude that your machine needs some boosting.
First Steps to Optimization
There are several other ways to optimize the report performance (i.e. production time). If you are dealing with millions of rows and about 50-100 columns, you should separate the data sources per dashboard. This is how you improve the dynamic performance. It is a good idea to choose hierarchical global filters to set up the context once for all dashboards.
As a second improvement, the data sources must be extracted as a Tableau Hyper data system (this is a native NoSQL technology that the Tableau server employs to keep track of calculated fields). Live data sources may be necessary for some use cases. However, if your data is bulky, the live connection update will take ages to be served. Beyond this, one can keep track of and remove the unused columns, and keep the data flow as clean as possible. After all these, how about static reports?
The Issue with Tableau and PDFs
The Tableau software was not built for the mass production of static reports such as PDFs. So be ready for pitfalls if you need to process millions of data rows presented on 10s of dashboards that are based on 100s of workbooks in order to produce 1000s of PDF reports. One can think that this would be a trivial task for a conventional Windows Server with 64 GB Ram and Intel 8 Core x 2GhZ CPU architecture. This hypothetical Windows Server machine is powerful enough as long as the reports are served dynamically to a limited number of users (order of 10s).
However, when dealing with PDFs, the internal optimizations of Tableau work against you. Let’s first understand what we are dealing with under the hood.

The Status Quo
There are mainly two ways to produce PDFs, PNGs, and CSVs from dynamic reports via filters e.g. reporting year (Y), company (C), and business case (B). Under the conditions given in the introduction, the production time will scale from 10s of seconds to a few minutes per report. This is not ideal, especially knowing that you may have to reproduce the whole batch a few times in case of errors.
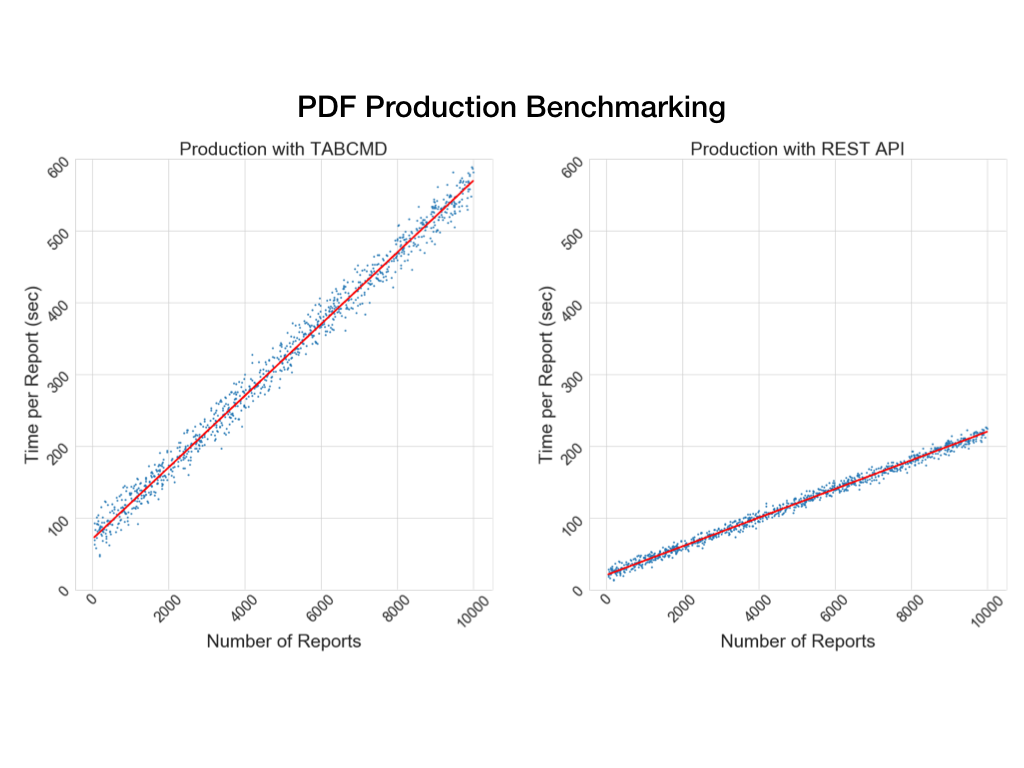
One way to produce a PDF is Tabcmd, which is a command-line tool for Tableau Server. It is installed on your local machine and it sends web requests to the Tableau Server to return a PDF report. The second way is the REST API that runs on the Tableau Server. It downloads the resulting PDF file to your local machine. Both can be automated by common tools such as Python or Node.js applications to produce multiple reports running through the mentioned filters: Y, C, and B.
REST API vs Tabcmd
There is one important difference between the two methods. That is the full import option vs. single dashboard import. This means that working with REST API, you need to download the pages one by one and merge them to produce the full report. In the case of Tabcmd, on the other hand, the reports will come as a whole. This includes additional pages to discard from your report later. Both methods can come in handy in the context of different cases. For example, many additional test dashboards may require page picking.
There is also one shared glitch of both methods structural to the server itself. That is to say, when dealing with PDFs, the internal optimizations of Tableau Server work against you. Tableau uses caching for the dynamic optimization of internal queries (which is not possible to turn off, unfortunately). In time, this will make the imports slower by a rate of about 0.5% per report. No problem for 10s of reports, obviously, but the slow-down sums up to 500% for 1000 PDFs.
This poses practical problems. The production time may be too slow to continue at some point. It will interfere with the other users’ activities. And the backend application might drop the database client connection depending on the idle time options. This is problematic for the enterprise-level automation of the reporting.
At this point, we assume that workflow automation is managed by a backend that connects to a DB and a Tableau Server. The pool connection to both servers provides the necessary data, meta-data, and finally logs the production meta-data to a DB. This being said, we assume that the bottleneck is still the Tableau server PDF production. And under the given conditions above, it still will be. Otherwise, you need to fix the bugs of your application first, say DB queries or workflow management.
The Takeaway
Our observation is that the REST API performs much better than Tabcmd in the case studies mentioned above. This means in about the order of 2-3 times. This is not an order-of-magnitude improvement, but the difference between 6 hours vs. 18 hours matters when we consider 8-hour workdays. Remember that Tableau Server was not designed for PDF mass production. Reducing the production time under 10 secs per report is a very intricate task. This might require a real boost to your existing computational resources (presumably 2x to 4x).
If your purpose is to get your PDF reports mass-produced, we can guarantee to improve the production mechanism for you.
Disclaimer: We are missing a true per computational resource efficiency argument. REST APIs are really greedy. This means that while Tabcmd would use only a percentage of the CPU, REST API would almost always claim the full power allocated to computations. This means all CPU resources minus the background processes.
Get in Touch for Projects
At Record Evolution, we have been consulting on data science and IT projects for many years. We help credit reporting companies enhance business insights using state-of-the-art visualization tools such as PowerBI, Tableau, and Qlick, all of which can be customized and extended using native Extension APIs.
Get in touch to get all the details on implementing Tableau reporting tools to get the most out of your data visualizations.
About Record Evolution
We are a data science and IoT team based in Frankfurt, Germany, that helps companies of all sizes innovate at scale. That’s why we’ve developed an easy-to-use industrial IoT platform that enables fast development cycles and allows everyone to benefit from the possibilities of IoT and AI.